How AI Is Transforming Road Asset Inventory at Scale
How mobile mapping and machine learning are making comprehensive road asset inventory accessible to Indian municipalities for the first time.
India's urban local bodies manage thousands of kilometres of roads with minimal spatial data. Manual inspection methods are slow, inconsistent, and offer only a snapshot in time. The combination of mobile mapping and AI-driven asset detection is changing what is operationally possible.
The Data Gap in Municipal Road Management
Most Indian municipalities maintain road networks in the range of 100 to 500 kilometres with no systematic spatial record of their physical assets. Maintenance decisions are driven by citizen complaints, political pressure, or the memory of field engineers. There is no objective baseline from which to measure deterioration or prioritise expenditure. Smart City grants and central government infrastructure programmes increasingly require a geo-referenced, queryable asset database as a condition of fund release — creating urgent demand for rapid, accurate inventory methods.
The Technology Behind Rapid Road Surveys
Our AI asset management platform underpins the entire classification and delivery workflow described below.
- Mobile Mapping Systems: Vehicle-mounted LiDAR and camera arrays capture the full road environment — carriageway, kerbs, drainage, signage, utilities — in a single pass at traffic speed. A 200 km network can be covered in four to five survey days, with data resolution sufficient for both geometric and condition assessment.
- Panoramic Imagery: High-resolution spherical cameras mounted alongside LiDAR provide photorealistic context for every point in the dataset. Asset classifiers trained on colour and geometry combined significantly outperform those using either modality alone.
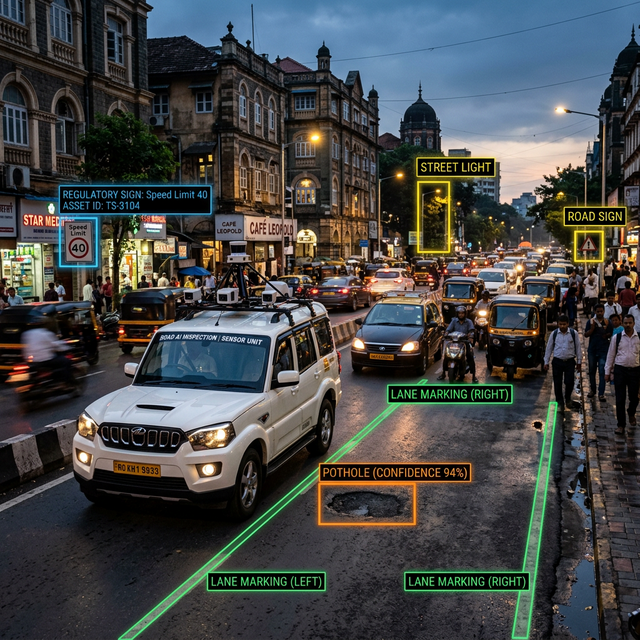
- AI Detection and Classification: Machine learning models trained on geo-referenced road datasets can detect and classify pavement distress types, road furniture, drainage structures, and signage with high mean average precision. Models trained on Indian road conditions generally outperform generic international training sets.
- GIS Delivery Platform: Output is typically a spatial database of asset records, each carrying geometry, imagery, condition score, and attribute data. Web-based GIS interfaces allow municipal engineers to query, filter, and export inventory data without specialist software.
A Typical Project Sequence
Phase 1: Mobile Survey Deployment The mobile mapping vehicle covers the target road network in planned daily routes, typically achieving 40 to 60 km per day. Raw LiDAR point clouds and synchronised imagery are captured for the full corridor — including features not visible from above, such as covered drains, underpass linings, and sign reverses.
Phase 2: AI Processing and Classification Automated processing runs pavement condition detection, road sign classification, and roadside asset extraction in parallel. A quality assurance team reviews AI outputs, corrects misclassifications, and validates geometric registration against ground control. The process typically takes four to six days for a 200 km network on modern hardware.
Phase 3: GIS Integration and Report Spatial data is loaded into the client's GIS platform or a web-based delivery interface. Pavement condition indices are computed per road segment. An executive report with heat maps, priority maintenance segments, and cost estimates is generated for the authority.
What the Data Reveals
Across road inventory projects in Indian municipalities, a consistent pattern emerges: typically 30 to 40 percent of mapped pavement defects and road furniture deficiencies were completely unknown to the managing authority prior to survey. This is not a failure of the engineering team — it is an inevitable consequence of managing large-area networks without systematic spatial data. The AI-driven approach converts that invisible problem into a structured, prioritisable asset register.
Why This Matters for Urban Governance
Urban local bodies worldwide face the same challenge: assets grow faster than the institutional capacity to track them. The economic case for data-driven maintenance is well established — maintenance budget allocated against objective condition data consistently outperforms reactive, complaint-driven spending on a cost-per-lane-kilometre basis. What has changed is the cost and speed of producing that data. Mobile LiDAR with AI classification has made comprehensive road asset inventory accessible to tier-2 and tier-3 Indian cities for the first time, not just for NHAI-class highway corridors.